Interactive climate visualization for NASA's Goddard Visitor Center.
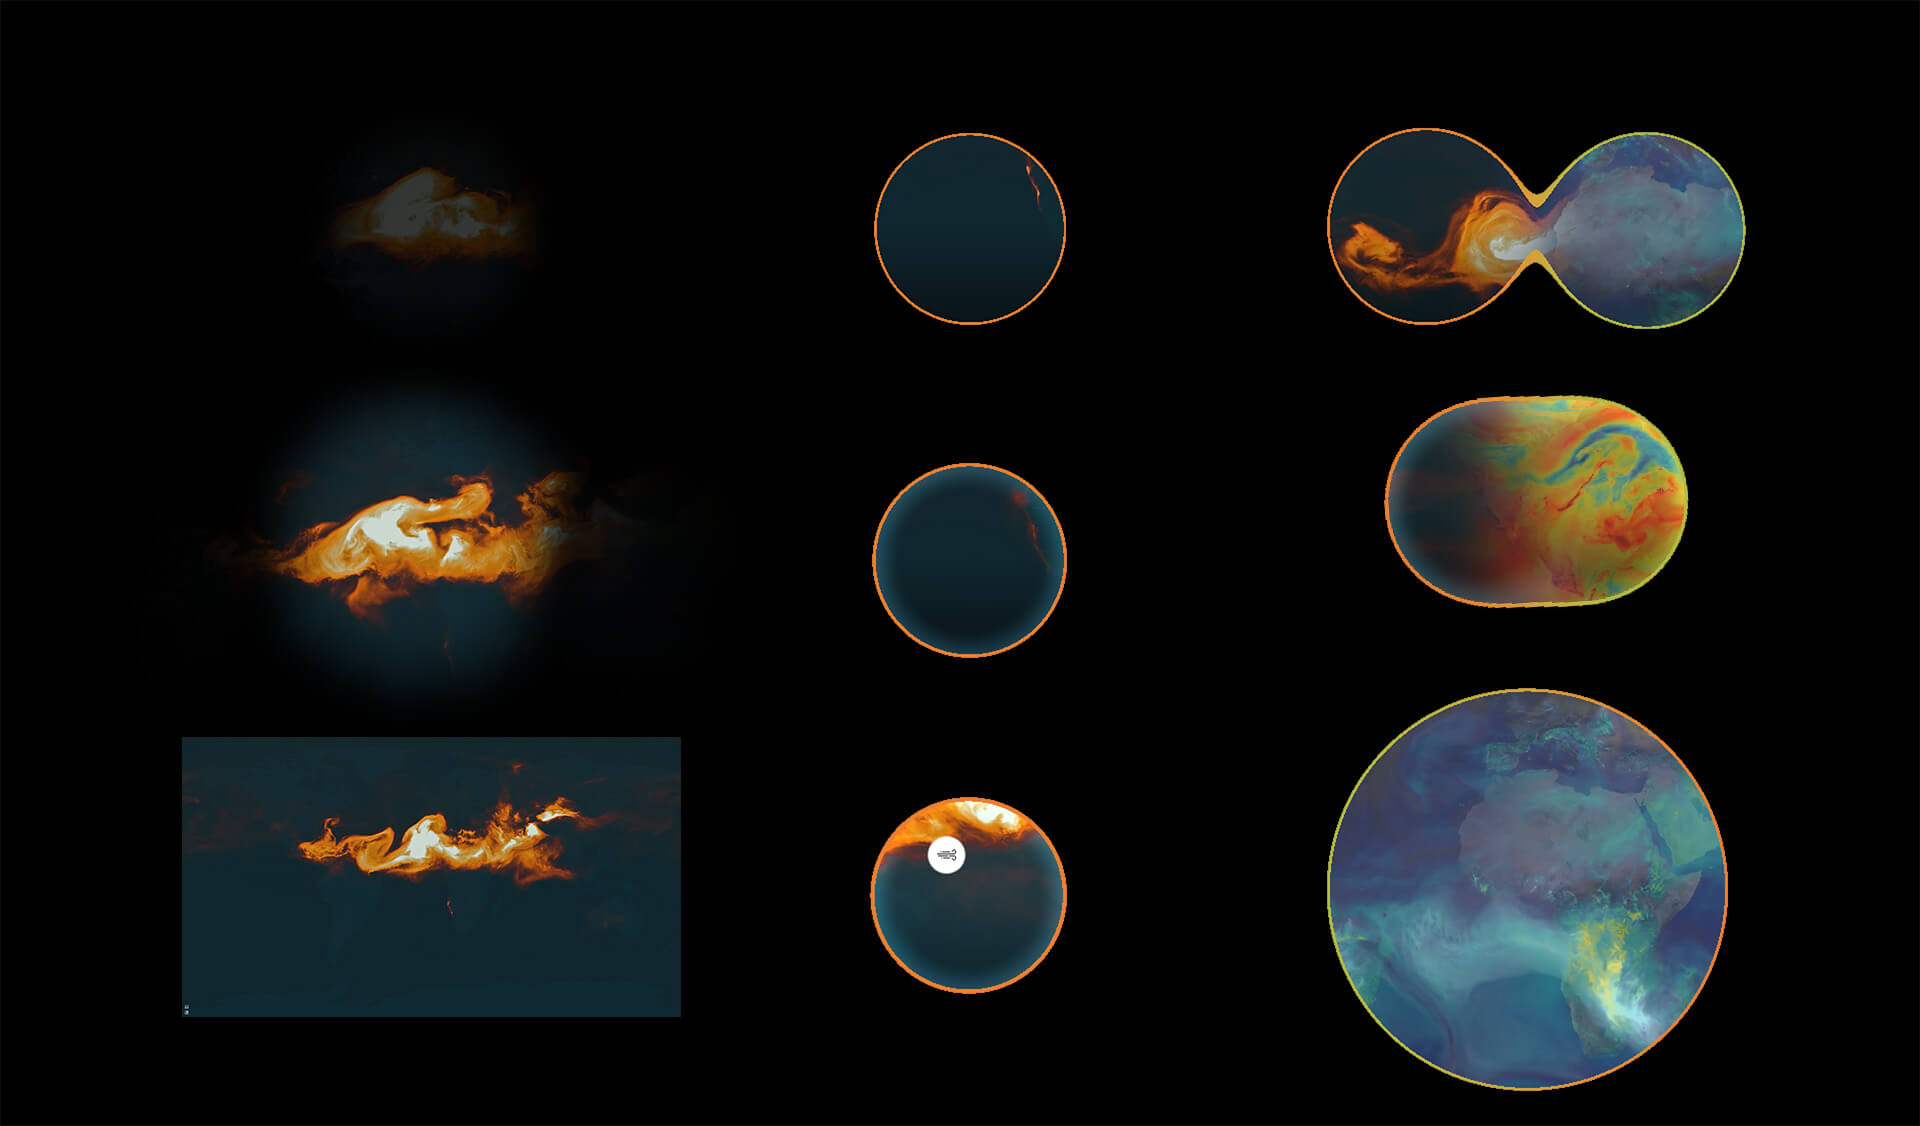
The scientists at NASA gather a trove of valuable climate data from space, the air and the ground. We worked with Goddard's Visualization Studio to build an interactive experience that explores the connections between climate phenomena across the globe.
The render pipeline, metaball and physics engines had to work hand-in-hand and required a good amount of optimization for speed and usability. Subtle animations indicate interactive states and the ability to merge or split lenses.
CLIENT
NASA Goddard Space Flight Center
ROLE
Tech Direction, Software Dev, Render Pipeline Dev
TECHNOLOGY
Cinder, C++, GLSL, Windows Media Foundation, Planar Touch
STUDIO
Bluecadet
TEAM
Brett Renfer (CD), Pete Hall (PM), Devon Burgoyne (Motion, Design), Nate Renninger (Design), Liz Russell (Content), Peter Chapman (Dev), Henry Steinberg (Dev).
PHOTOGRAPHY
Dan King for Bluecadet
PRESS & AWARDS
CommArts Exhibit Feature
CommArts Award of Excellence, Environmental
Fast Company Finalist, World Changing Award Ideas
MW Glami Awards Finalist
SEGD Project Feature
SEGD Design Awards Merit Winner
SEGD Global Design Awards Finalist
SXSW Finalist – Interactive Awards
Technical.ly Project Feature
Metaballs +
Motion Vocabulary +
2,985,984,000 px/s
Built in Cinder, this app renders up to 6x 4K videos in real time at 60fps and allows visitors to explore visualization through lenses, visualized as metaballs. Each lens highlights one set of data, and two lenses can be merged by dragging them together. Merging was done via a simple SDF shader, but the animation itself required a lot of nuance to properly convey all the hit states and UI states.

The render pipeline involved different phases, from metaballs, to masking and video composition.


