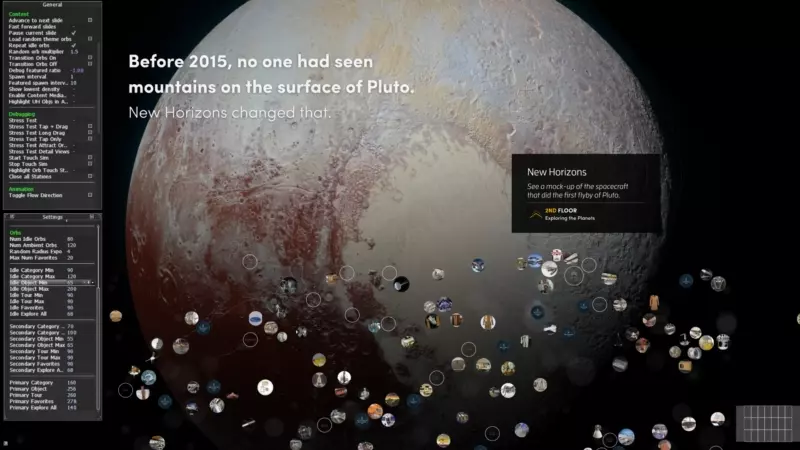
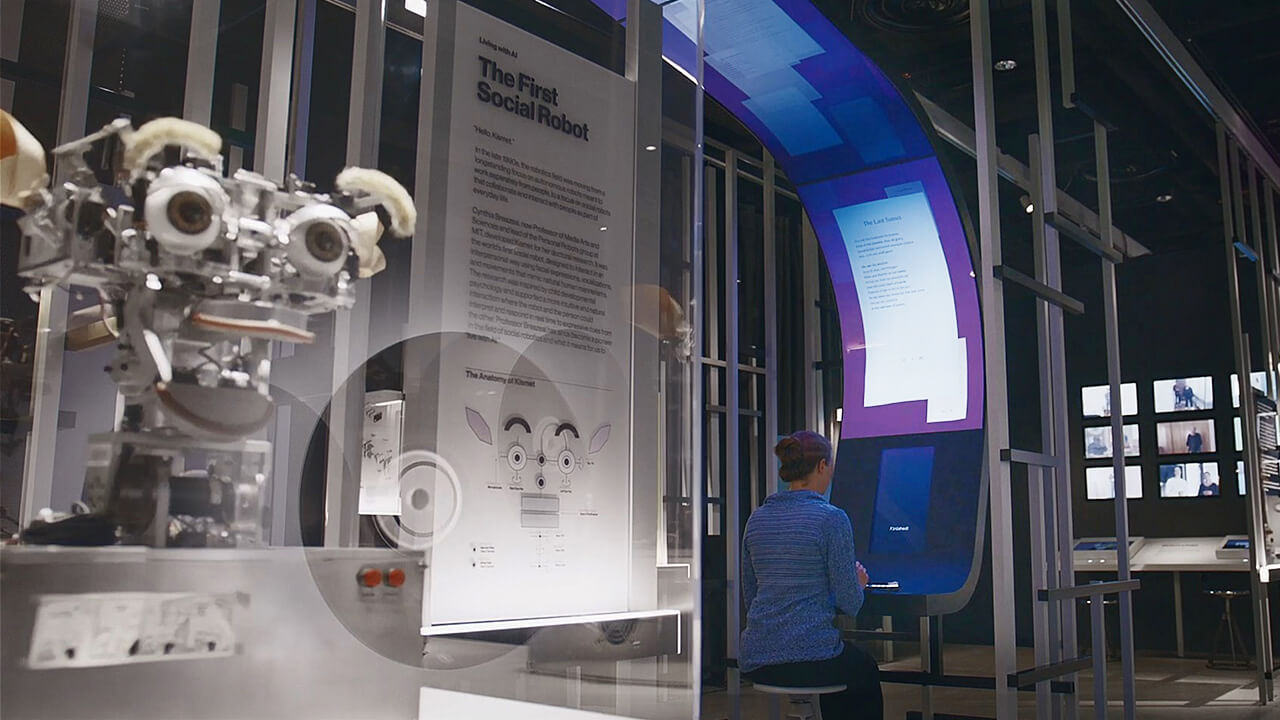
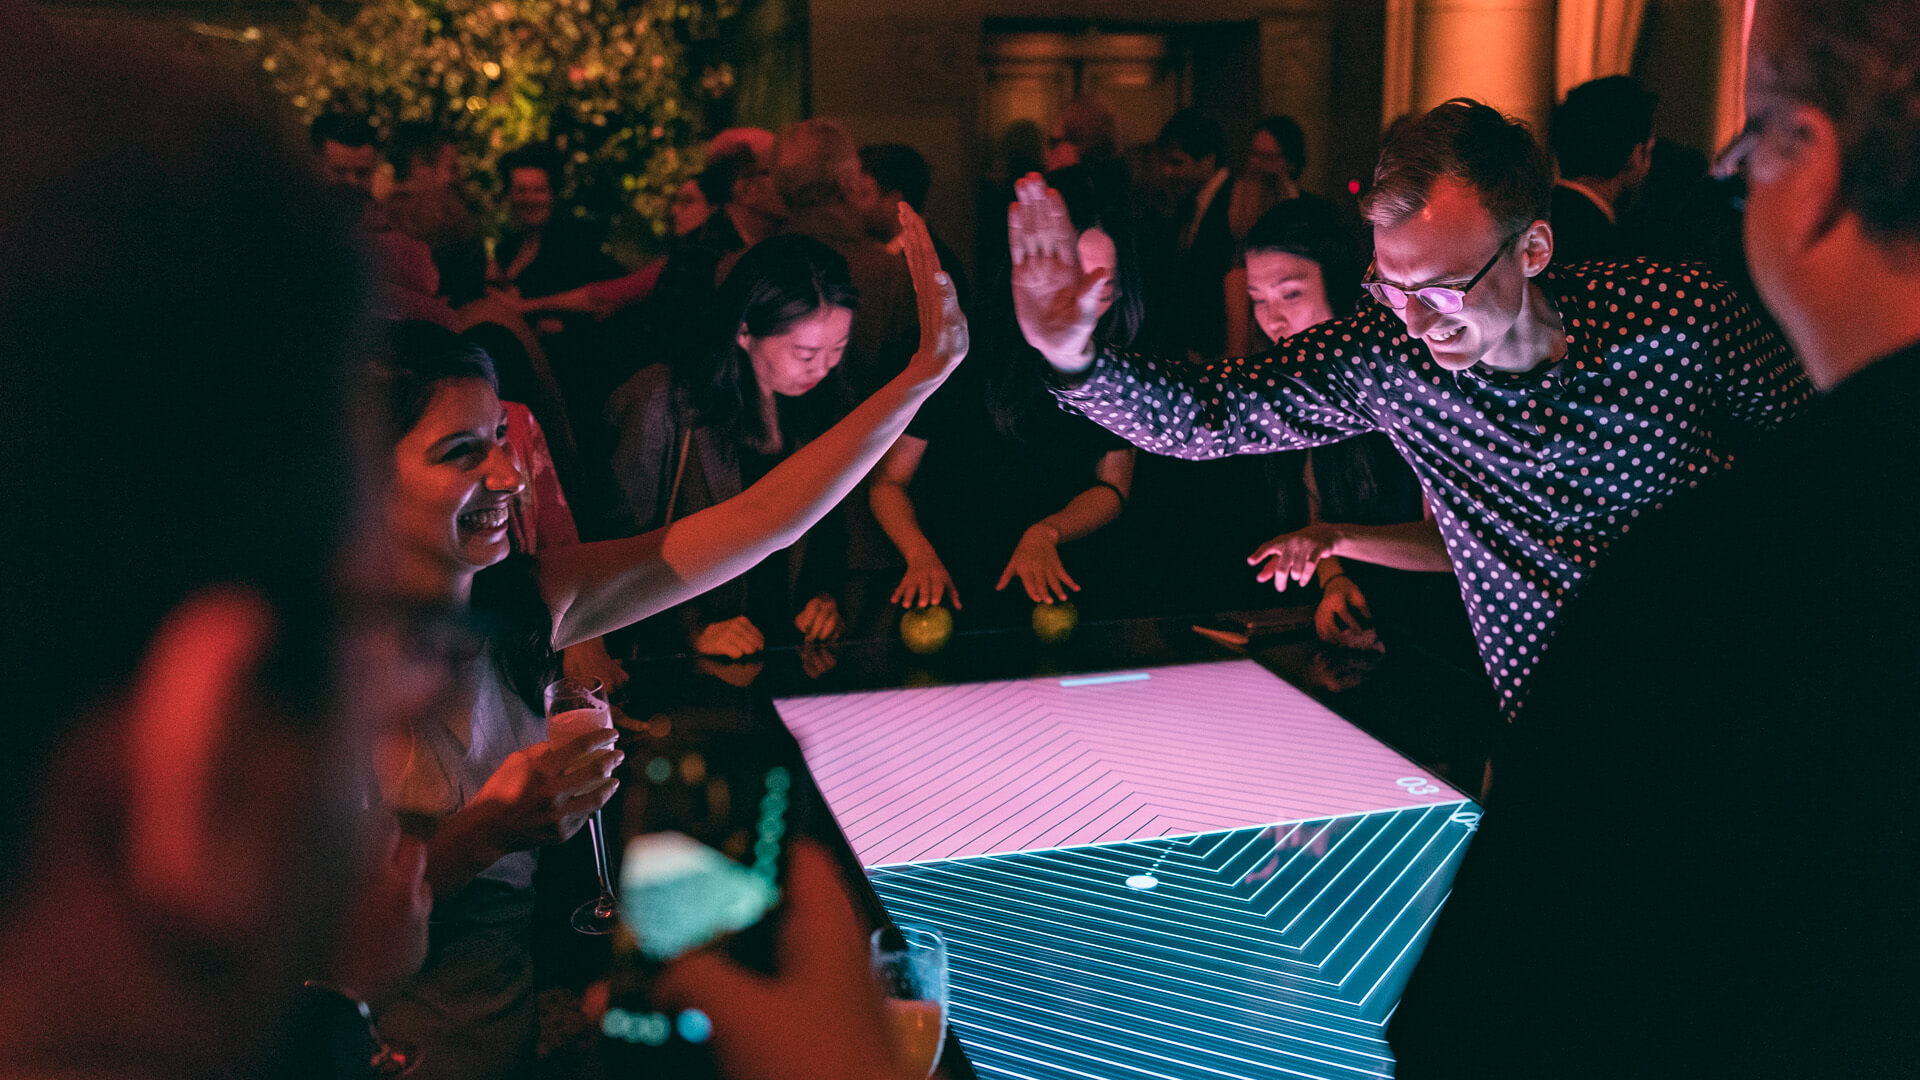
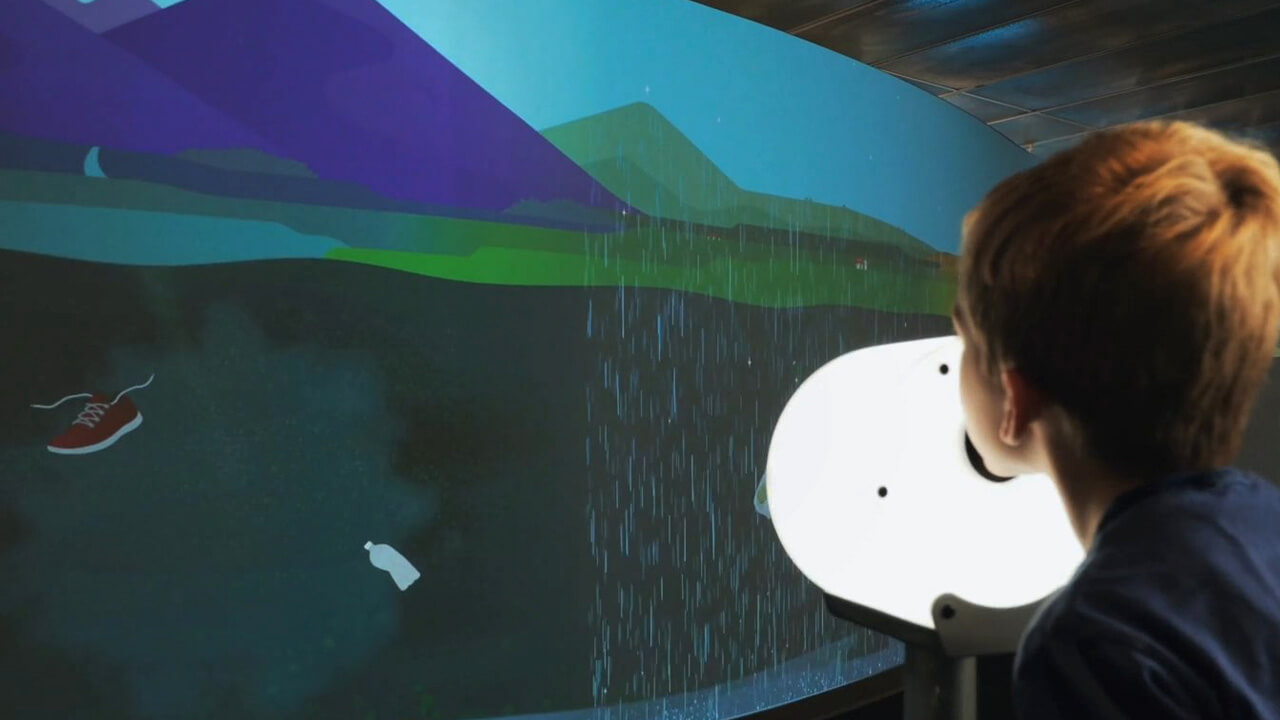
Interactive wall with 21 screens & thousands of artifacts from the museum's collection, driven by one PC.
As a huge space and aviation nerd, this was a true passion project for me and my first project at Bluecadet. I created a scene-graph and various utilities from scratch to jump start the team with a flexible MVC-based view systems, co-developed the application, led the work to surface the right content from thousands of artifacts and managed the display output configuration with NASM's IT team to get a single Cinder app rendered across 21 displays in 2015.
CLIENT
Smithsonian National Air and Space Museum
ROLE
Tech Direction, Software Dev, AV Coordination and Troubleshooting, Install
TECHNOLOGY
Cinder, C++, Nvidia Quadro Mosaic + Sync, Planar LCD Matrix, IR Touchframe
Studio
Bluecadet
TEAM
Aaron Richardson (CD), Stacey Martens (Dev), Paul Rudolph (Dev)
PHOTOGRAPHY
Dan King for Bluecadet
PRESS, AWARDS & SPEAKING
DSE Apex Awards: Silver, Arts, Entertainment, RecreationDSE Apex Awards: Silver, Arts, Entertainment, Recreation
DSE Conference 2017, A Platform Strategy for One of the Most Visited Locations in America
HOW International Design Awards Merit Winner
W3 Awards Gold, Mobile Apps Cultural
W3 Awards Gold, General Web, Cultural
W3 Awards Gold, Web Features, UX
Air and Space Magazine Project Feature
Digital Gov Project Feature
Washingtonian Project Feature
Scene Graph
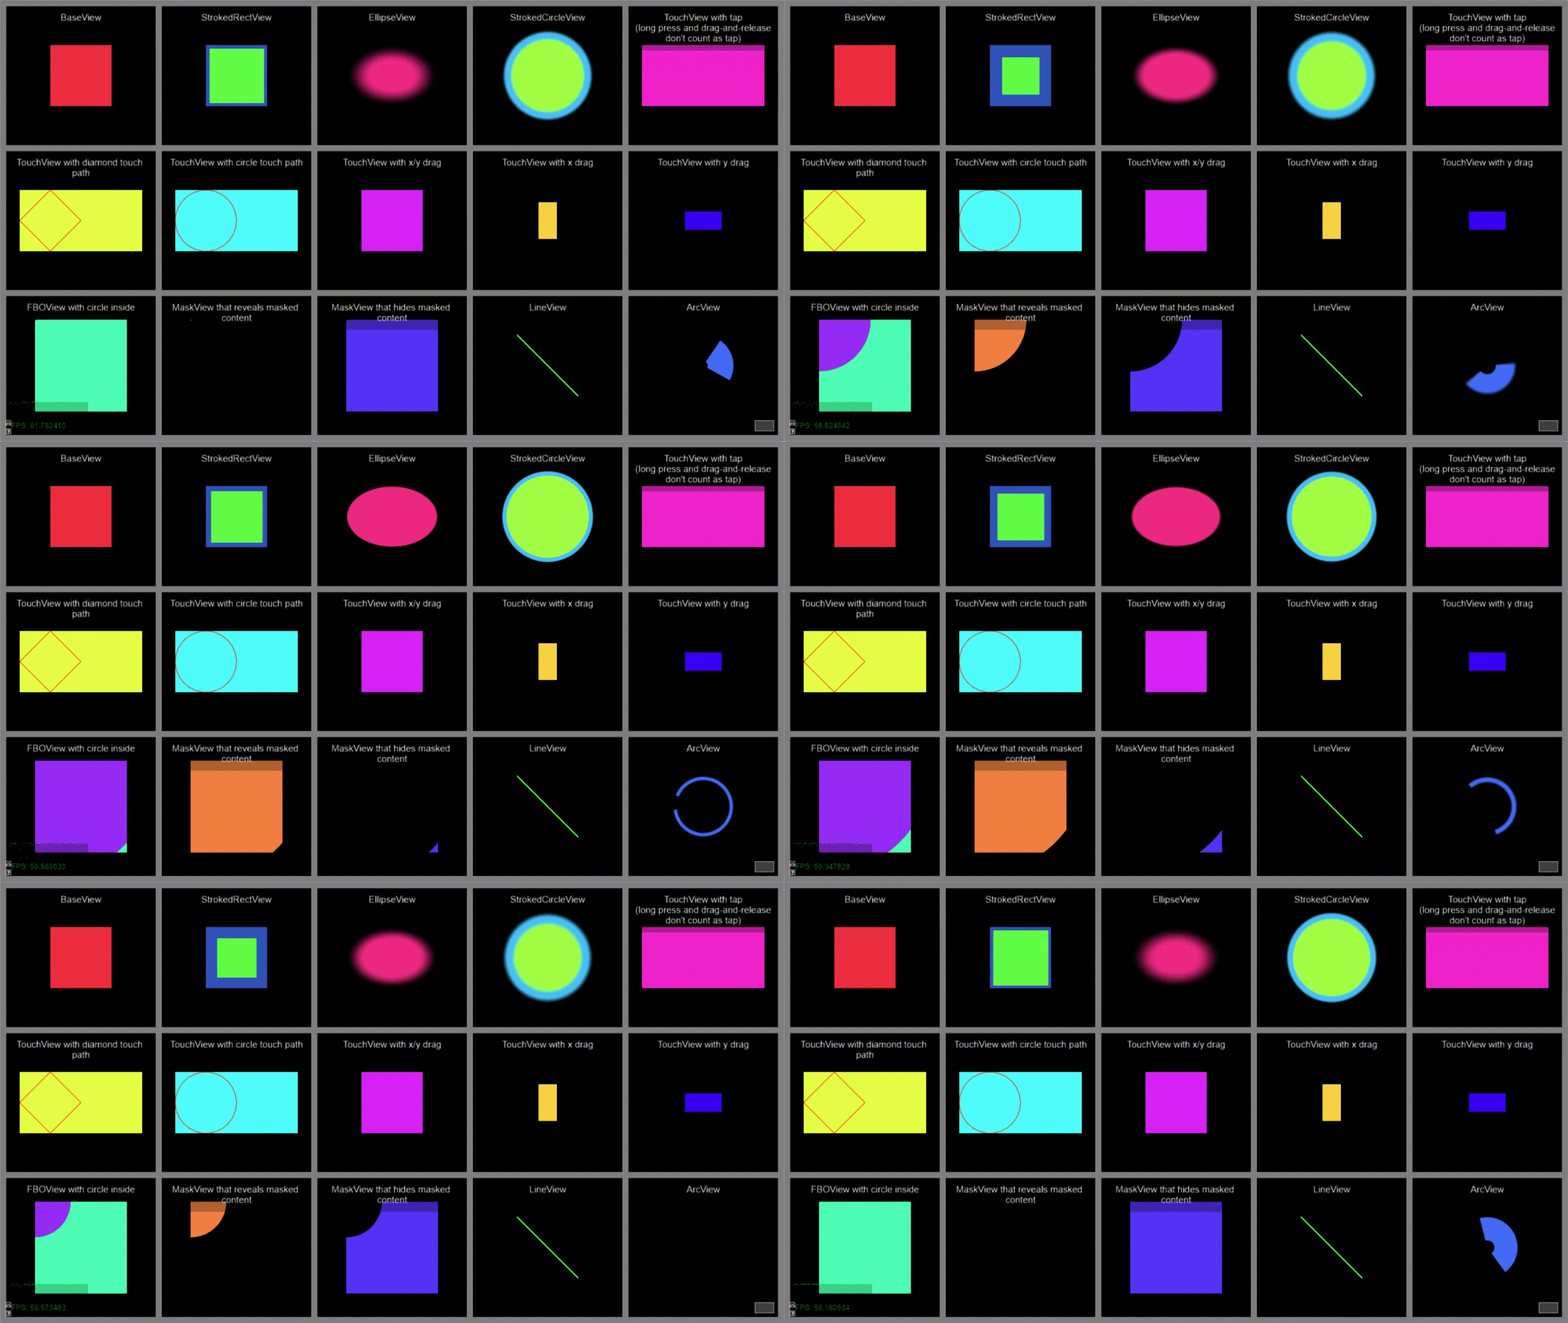
When I came on board, Bluecadet basically had no common libraries for their Cinder and exhibition work. I used this project to build a robust scene graph, BluecadetViews, that eventually became the foundation for all future Bluecadet Cinder projects.
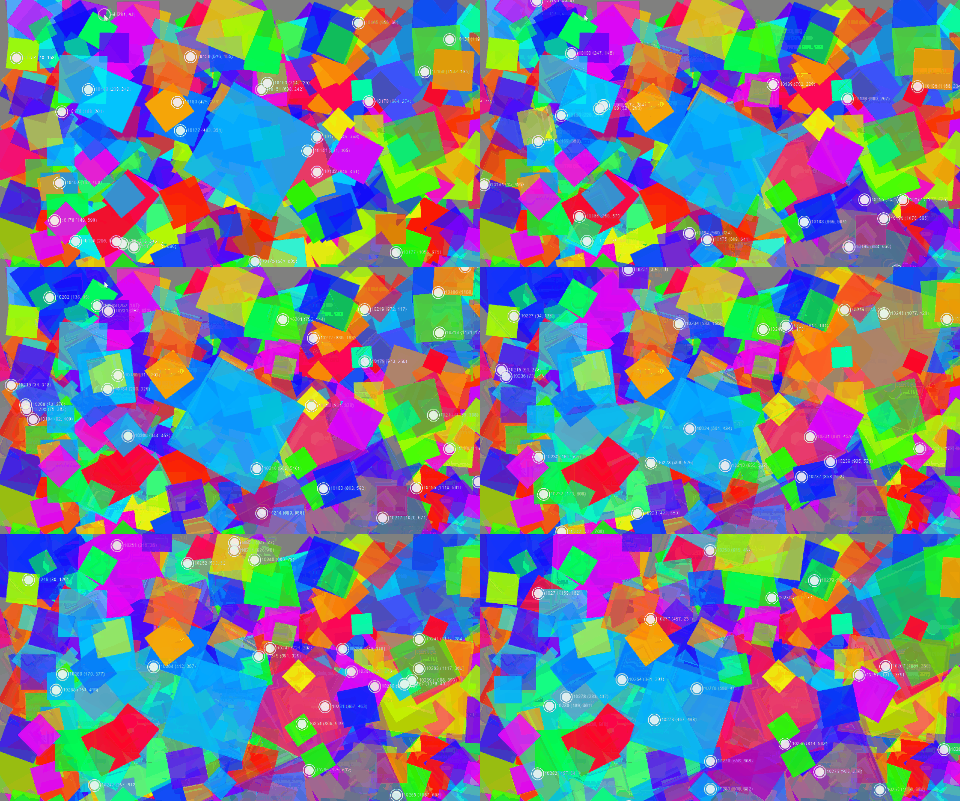
It includes a plethora of view types, CSS-style text-formatting, complex transforms for gestures, tools for metrics and stress testing (a.k.a. "a thousand tiny hands") and made developing a 21-screen matrix app on a 15" laptop attainable.
AV Configuration
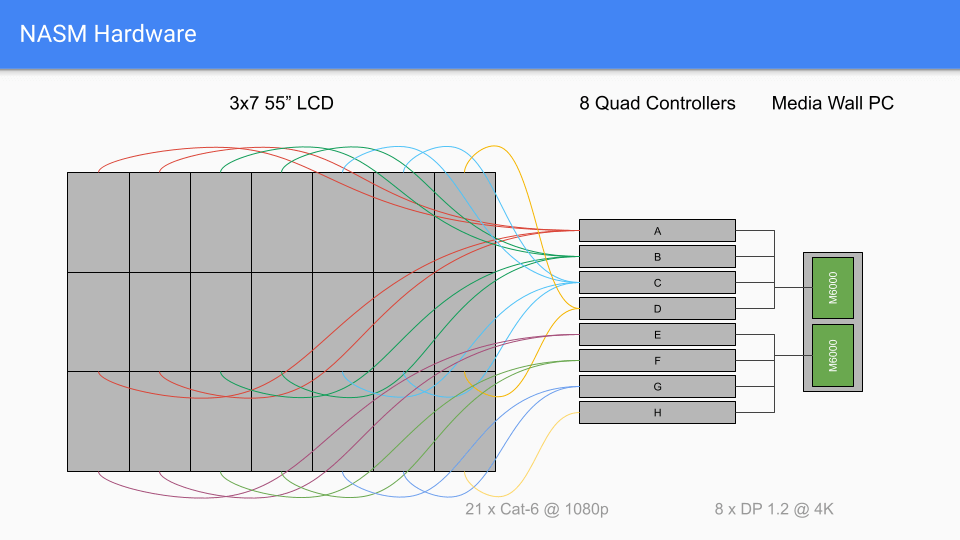
Back in 2015, creating a single canvas on 7x3 HD displays driven by a single PC was not an easily solved problem. The PC itself ran on a dual Xeon (would not recommend again) and two Nvidia M6000 Quadros with a Quadro Sync card (these worked great!).
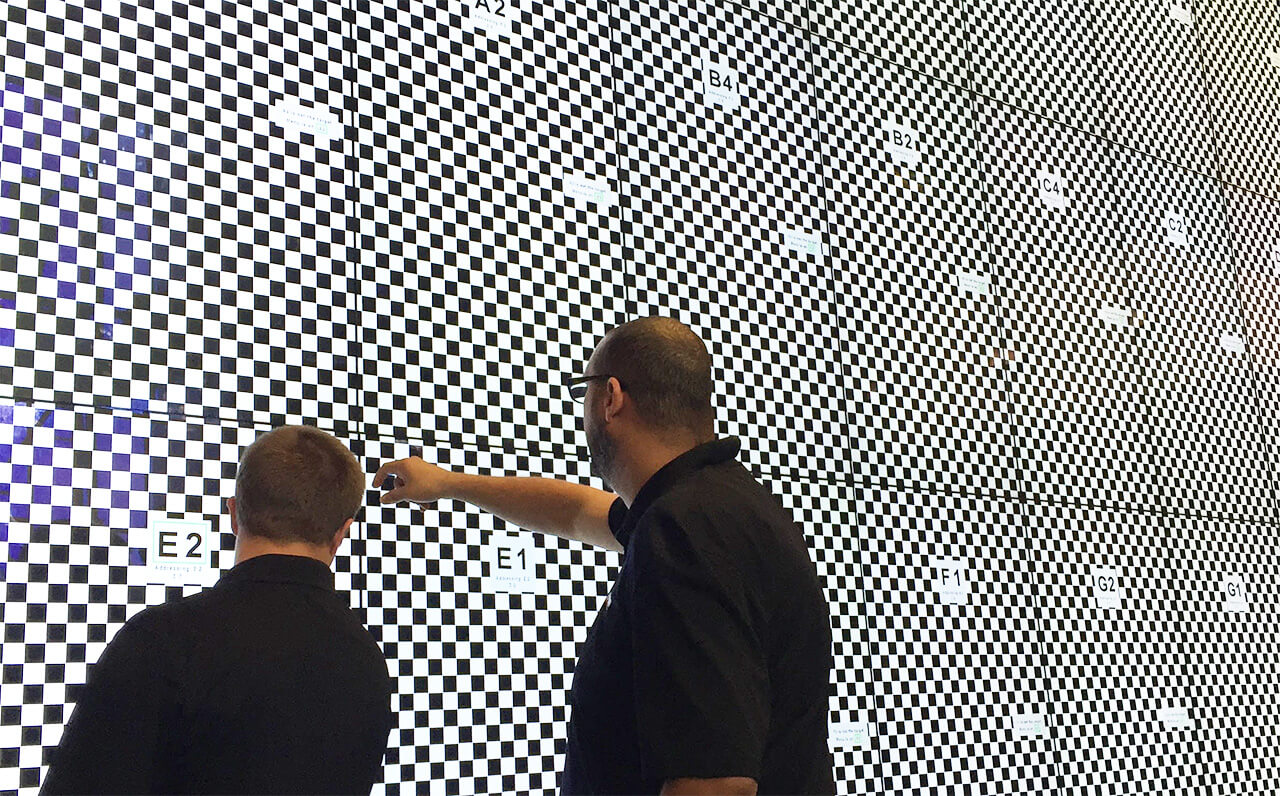
Each Quadro card was able to output 4x 4K streams, which were then split by 8 Planar Quad Controllers into 21 individual HD signals. Under the hood, Nvidia Mosaic had to be carefully configured with overlapping and offsets, and screens had to be oriented and aligned correctly to minimize screen tearing.
I developed custom tools to visualize screen tearing (and induce a slight dose of naseau on such a large canvas) and worked directly with Smithonian's AV and Nvidia's driver technicians to get the wall running smoothly.
Data Pipeline
At the beginning of the project, the museum basically had a flat collection with tags. We worked with the museum to add hierarchy via another layer of nested taxonomy (e.g. Space ➡️ Space Flight ➡️ Space Capsules).
Dialing in what content got surfaced when required careful tweaking and multiple layers of queries. In order to test the desired distribution of high priority artifacts like the Apollo Command Module and more esoteric objects like a toothbrush, I wrote multiple visualizers and parametric demos to quickly iterate over the details of all of these algorithms.
